|
Statistical Parametric Mapping |
|
|
Karl J Friston |
|
|
Wellcome Dept. of Imaging Neuroscience |
This section considers the different sorts of designs that can be employed in neuroimaging studies. Experimental designs can be classified as single factor or multifactorial designs, within this classification the levels of each factor can be categorical or parametric. We will start be discussing categorical and parametric designs and then deal with multifactorial designs.
The tenet of cognitive subtraction is that the difference between two tasks can be formulated as a separable cognitive or sensorimotor component and that regionally specific differences in hemodynamic responses, evoked by the two tasks, identify the corresponding functionally specialized area. Early applications of subtraction range from the functional anatomy of word processing (Petersen et al 1989) to functional specialization in extrastriate cortex (Lueck et al 1989). The latter studies involved presenting visual stimuli with and without some sensory attribute (e.g. color, motion etc). The areas highlighted by subtraction were identified with homologous areas in monkeys that showed selective electrophysiological responses to equivalent visual stimuli.
Cognitive conjunctions (Price and Friston 1997) can be thought of as an extension of the subtraction technique, in the sense that they combine a series of subtractions. In subtraction ones tests a single hypothesis pertaining to the activation in one task relative to another. In conjunction analyses several hypotheses are tested, asking whether all the activations, in a series of task pairs, are jointly significant. Consider the problem of identifying regionally specific activations due to a particular cognitive component (e.g. object recognition). If one can identify a series of task pairs whose differences have only that component in common, then the region which activates, in all the corresponding subtractions, can be associated with the common component. Conjunction analyses allow one to demonstrate the context-invariant nature of regional responses. One important application of conjunction analyses is in multi-subject fMRI studies, where generic effects are identified as those that are conjointly significant in all the subjects studied (see Section VII).
The premise behind parametric designs is that regional physiology will vary systematically with the degree of cognitive or sensorimotor processing or deficits thereof. Examples of this approach include the PET experiments of Grafton et al (1992) that demonstrated significant correlations between hemodynamic responses and the performance of a visually guided motor tracking task. On the sensory side Price et al (1992) demonstrated a remarkable linear relationship between perfusion in peri-auditory regions and frequency of aural word presentation. This correlation was not observed in Wernicke's area, where perfusion appeared to correlate, not with the discriminative attributes of the stimulus, but with the presence or absence of semantic content. These relationships or neurometric functions may be linear or nonlinear. Using polynomial regression, in the context of the GLM, one can identify nonlinear relationships between stimulus parameters (e.g. stimulus duration or presentation rate) and evoked responses. To do this one usually uses a SPM{F} (see Büchel et al 1996).
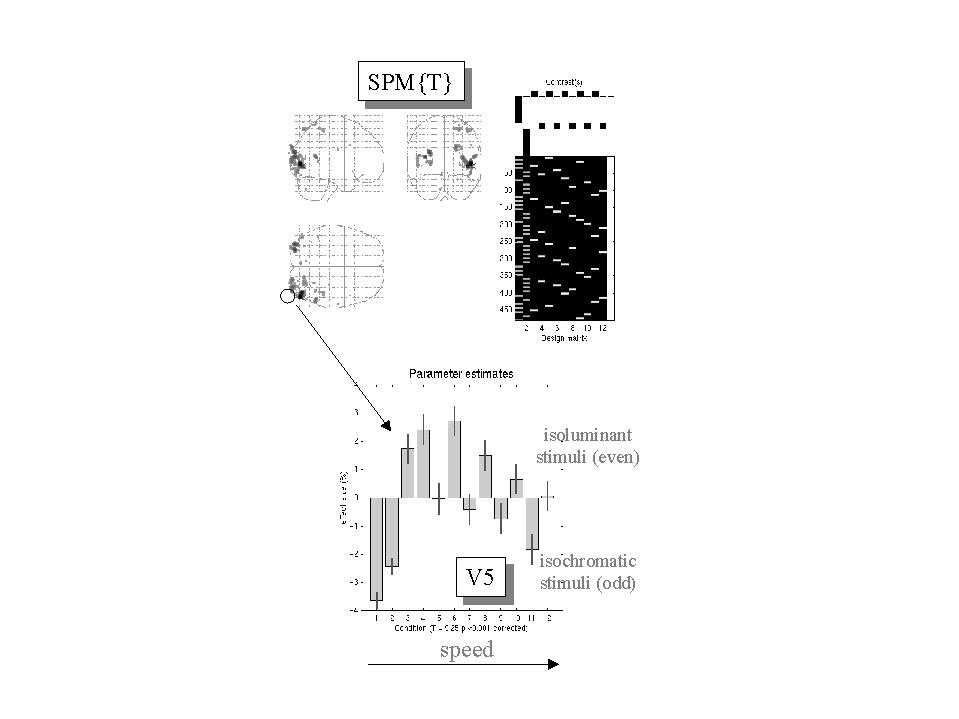
The example provided in Figure 7 illustrates both categorical and parametric aspects of design and analysis. These data were obtained from a fMRI study of visual motion processing using radially moving dots. The stimuli were presented over a range of speeds using isoluminant and isochromatic stimuli. To identify areas involved in visual motion a stationary dots condition was subtracted from the moving dots conditions (see the contrast weights on the upper right). To ensure significant motion-sensitive responses, using both color and luminance cues, a conjunction of the equivalent subtractions was assessed under both viewing contexts. Areas V5 and V3a are seen in the ensuing SPM{T}. The T values in this SPM are simply the minimum of the T values for each subtraction. Thresholding this SPM{Tmin} ensures that all voxels survive the threshold u in each subtraction separately. This conjunction SPM has an equivalent interpretation; it represents the intersection of the excursion sets, defined by the threshold u, of each component SPM. This intersection is the essence of a conjunction. The expressions in Figure 6 pertain to the general case of the minimum of n T values. The special case where n = 1 corresponds to a conventional SPM{T}.
The responses in left V5 are shown in the lower panel of Figure 7 and speak to a compelling inverted 'U' relationship between speed and evoked response that peaks at around 8 degrees per second. It is this sort of relationship that parametric designs try to characterize. Interestingly the form of these speed-dependent responses was similar using both stimulus types, although luminance cues are seen to elicit a greater response. From the point of view of a factorial design there is a main effect of cue (isoluminant vs. isochromatic), a main [nonlinear] effect of speed, but no speed by cue interaction.
Clinical neuroscience studies can use parametric designs by looking for the neuronal correlates of clinical (e.g. symptom) ratings over subjects. In many cases multiple clinical scores are available for each subject and the statistical design can usually be seen as a multilinear regression. In situations where the clinical scores are correlated principal component analysis or factor analysis is sometimes applied to generate a new, and smaller, set of explanatory variables that are orthogonal to each other. This has proved particularly useful in psychiatric studies where syndromes can be expressed over a number of different dimensions (e.g. the degree of psychomotor poverty, disorganization and reality distortion in schizophrenia. See Liddle et al 1992). In this way, regionally specific correlates of various symptoms may point to their distinct pathogenesis in a way that transcends the syndrome itself. For example psychomotor poverty may be associated with left dorsolateral prefrontal dysfunction irrespective of whether the patient is suffering from schizophrenia or depression.
Figure 7. Top right: Design matrix: This is an image representation of the design matrix. Contrasts: These are the vectors of contrast weights defining the linear compounds of parameters tested. The contrast weights are displayed over the column of the design matrix that corresponds to the effects in question. The design matrix here includes condition-specific effects (boxcars convolved with a hemodynamic response function). Odd columns correspond to stimuli shown under isochromatic conditions and even columns model responses to isoluminant stimuli. The first two columns are for stationary stimuli and the remaining columns are for conditions of increasing speed. The final column is a constant term. Top left: SPM{T}: This is a maximum intensity projection of the SPM{T} conforming to the standard anatomical space of Talairach and Tournoux (1988). The T values here are the minimum T values from both contrasts, thresholded at p = 0.001 uncorrected. The most significant conjunction is seen in left V5. Lower panel: Plot of the condition-specific parameter estimates for this voxel. The T value was 9.25 (p<0.001 corrected - see Figure 6).
Factorial designs are becoming more prevalent than single factor designs because they enable inferences about interactions. At its simplest an interaction represents a change in a change. Interactions are associated with factorial designs where two or more factors are combined in the same experiment. The effect of one factor, on the effect of the other, is assessed by the interaction term. Factorial designs have a wide range of applications. An early application, in neuroimaging, examined physiological adaptation and plasticity during motor performance, by assessing time by condition interactions (Friston et al 1992a). Psychopharmacological activation studies are further examples of factorial designs (Friston et al 1992b). In these studies cognitively evoked responses are assessed before and after being given a drug. The interaction term reflects the pharmacological modulation of task-dependent activations. Factorial designs have an important role in the context of cognitive subtraction and additive factors logic by virtue of being able to test for interactions, or context-sensitive activations (i.e. to demonstrate the fallacy of 'pure insertion'. See Friston et al 1996c). These interaction effects can sometimes be interpreted as (i) the integration of the two or more [cognitive] processes or (ii) the modulation of one [perceptual] process by another being manipulated. See Figure 8 for an example. From the point of view of clinical studies interactions are central. The effect of a disease process on sensorimotor or cognitive activation is simply an interaction and involves replicating a subtraction experiment in subjects with and without the pathophysiology being studied. Factorial designs can also embody parametric factors. If one of the factors has a number of parametric levels, the interaction can be expressed as a difference in regression slope of regional activity on the parameter, under both levels of the other [categorical] factor. An important example of factorial designs, that mix categorical and parameter factors, are those looking for psychophysiological interactions. Here the parametric factor is brain activity measured in a particular brain region. These designs have proven useful in looking at the interaction between bottom-up and top-down influences within processing hierarchies in the brain (Friston et al 1997). This issue will be addressed below in Section VIII from the point of view of effective connectivity.

Figure 8. Results showing how to assess an interaction using an event-related design. Subjects viewed stationary monochromatic stimuli that occasionally changed color and moved at the same time. These compound events were presented under two levels of attentional set (attention to color and attention to motion), The event-related responses are modeled, in an attention-specific fashion by the first four regressors (delta functions convolved with a hemodynamic response function and its derivative) in the design matrix on the right. The simple main effects of attention are modeled as similarly convolved boxcars. The interaction between attentional set and visually evoked responses is simply the difference in evoked responses under both levels of attention and is tested for with the appropriate contrast weights (upper right). Only the first 256 rows of the design matrix are shown. The most significant modulation of evoked responses under attention to motion was seen in left V5 (insert). The fitted responses and their standard errors are shown on the left as functions of peristimulus time.