Figure 11
Left
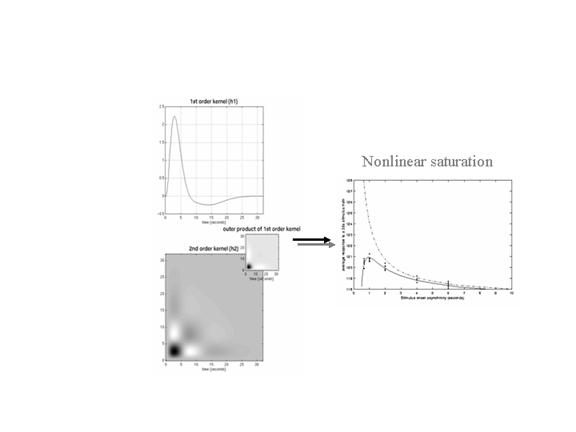
panels: Volterra kernels from a voxel in the left superior temporal gyrus at
-56, -28, 12mm. These kernel estimates
were based on a single subject study of aural word presentation at different
rates (from 0 to 90 words per minute) using a second order approximation to a
Volterra series expansion modeling the observed hemodynamic response to
stimulus input (a delta function for each word). These kernels can be thought of as a
characterization of the second order hemodynamic response function. The first order kernel ![]() (upper panel) represents the (first order) component usually
presented in linear analyses. The second
order kernel (lower panel) is presented in image format. The color scale is arbitrary; white is
positive and black is negative. The
insert on the right represents
(upper panel) represents the (first order) component usually
presented in linear analyses. The second
order kernel (lower panel) is presented in image format. The color scale is arbitrary; white is
positive and black is negative. The
insert on the right represents ![]() , the second order kernel that would be predicted by a simple
model that involved linear convolution with
, the second order kernel that would be predicted by a simple
model that involved linear convolution with ![]() followed by some
static nonlinearity.
followed by some
static nonlinearity.
Right panel: Integrated responses over a 32-second stimulus train as a function of SOA. Solid line: Estimates based on the nonlinear convolution model parameterized by the kernels on the left. Broken line: The responses expected in the absence of second order effects (i.e. in a truly linear system). Dots: Empirical averages based on the presentation of actual stimulus trains.