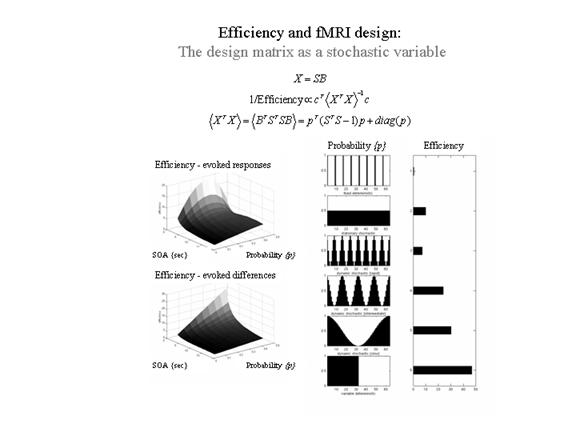
Figure 12
Efficiency as a
function of occurrence probabilities p.
for a model X formed by
post-multiplying S (a matrix
containing n columns, modeling n possible event-related responses every
SOA) by B. B is a random binary vector that
determines whether the nth response
is included in X or not, where![]() . Right panels: A
comparison of some common designs. A graphical representation of the occurrence
probabilities p expressed as a
function of time (seconds) is shown on the left and the corresponding
efficiency is shown on the right. These
results assume a minimum SOA of one second, a time-series of 64 seconds and a
single trial-type. The expected number
of events was 32 in all cases (apart from the first). Left panels: Efficiency in a stationary
stochastic design with two event types both presented with probability p every SOA. The upper graph is for a contrast testing for
the response evoked by one trial type and the lower graph is for a contrast
testing for differential responses.
. Right panels: A
comparison of some common designs. A graphical representation of the occurrence
probabilities p expressed as a
function of time (seconds) is shown on the left and the corresponding
efficiency is shown on the right. These
results assume a minimum SOA of one second, a time-series of 64 seconds and a
single trial-type. The expected number
of events was 32 in all cases (apart from the first). Left panels: Efficiency in a stationary
stochastic design with two event types both presented with probability p every SOA. The upper graph is for a contrast testing for
the response evoked by one trial type and the lower graph is for a contrast
testing for differential responses.