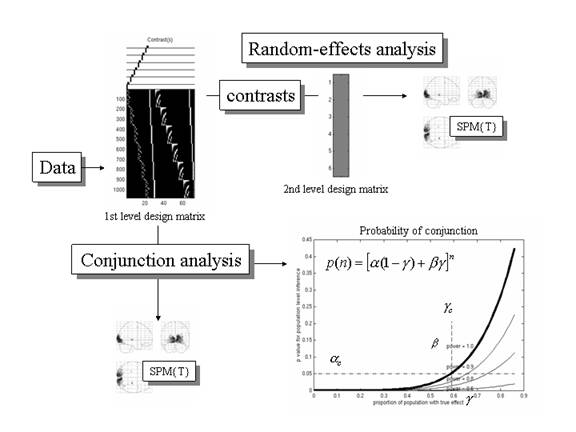
Figure 13
Schematic illustrating the implementation of random-effect and conjunction analyses for population inference. The lower right graph shows the probability p(n) of obtaining a conjunction over n subjects, conditional on a certain proportion g of the population expressing the effect, for a test with specificity of a = 0.05, at several sensitivities (b = 1, 0.9, 0.8 and 0.6). The broken lines denote the critical specificity for population inference ac and the associated proportion of the population gc.