1. Getting started
For start-up from Matlab, type spm.
Select from:
Studies are considered as a series of independent scans
fMRI (or enter spm fmri)
N.B.
The interface and usage for the above models of operation are similar. Differences between these components are indicated where applicable.
SPM'99 information
Link to the SPM-pages of the Wellcome Dept of Imaging Neuroscience website (http://www.fil.ion.ucl.ac.uk/spm)
Exits SPM, closes windows and clears workspace variables
N.B.
The directory from which SPM is started becomes the SPM working directory, to which a graphical output file spm99.ps (postscript file containing displays) and the results of statistical analyses are written.
The spm99.ps file is appended when written to. SPM signals the risk of overwriting previous statistical results.
The SPM graphical user interface
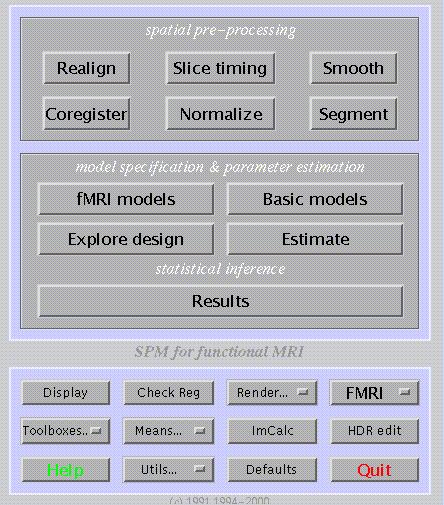
The SPM graphical user interface (shown above) is divided into three panels: the upper for spatial pre-processing of data, the middle for model specification/estimation and statistical inference, and the lower for general utilities (shown above for fMRI).
Spatial pre-processing functions are:
Realign: realignment of functional time-series
Coregister: Coregistration of same modality and multi-modality image volumes
Slice timing: Adjustment for timing differences in multi-slice image acquisition (fMRI)
Normalize: Spatial normalisation of image volumes to a template
Smooth: Convolution of image volume with a Gaussian kernel
Segment: Segmentation of MRI volume(s) into CSF, grey and white matter
Model specification & parameter estimation:
fMRI and PET/SPECT models: set-up of modality-specific models
Basic models: basic statistical models for independent data
Explore design: review a previously specified model
Estimate: estimation of a previously specified model and configuration
Statistical inference:
Results: analysis and display of regional effects
The lower panel includes miscellaneous and general utility functions.