|
Statistical Parametric Mapping |
|
|
Karl J Friston |
|
|
Wellcome Dept. of Imaging Neuroscience |
Imaging neuroscience has firmly established functional specialization as a principle of brain organization in man. The functional integration of specialized areas has proven more difficult to assess. Functional integration is usually inferred on the basis of correlations among measurements of neuronal activity. Functional connectivity has been defined as correlations between remote neurophysiological events. However correlations can arise in a variety of ways: For example in multi-unit electrode recordings they can result from stimulus-locked transients evoked by a common input or reflect stimulus-induced oscillations mediated by synaptic connections (Gerstein and Perkel 1969). Integration within a distributed system is usually better understood in terms of effective connectivity: Effective connectivity refers explicitly to the influence that one neural system exerts over another, either at a synaptic (i.e. synaptic efficacy) or population level. It has been proposed that "the [electrophysiological] notion of effective connectivity should be understood as the experiment- and time-dependent, simplest possible circuit diagram that would replicate the observed timing relationships between the recorded neurons" (Aertsen and Preißl 1991). This speaks to two important points: (i) Effective connectivity is dynamic, i.e. activity- and time-dependent and (ii) it depends upon a model of the interactions. The estimation procedures employed in functional neuroimaging can be classified as (i) those based directly on regression (Friston et al 1995d) or (ii) structural equation modeling (McIntosh et al 1994) (i.e. path analysis).
There is a necessary relationship between approaches to characterizing functional integration and multivariate analyses because the latter are necessary to model interactions among brain regions. Multivariate approaches can be divided into those that are inferential in nature and those that are data led or exploratory.. We will first consider multivariate approaches that are universally based on functional connectivity or covariance patterns (and are generally exploratory) and then turn to models of effective connectivity (that usually allow for some form of inference)
Most analyses of covariances among brain regions are based on the singular value decomposition (SVD) of the between-voxel covariances in a neuroimaging time-series In Friston et al (1993) we introduced voxel-based principal component analysis (PCA) of neuroimaging time-series to characterize distributed brain systems implicated in sensorimotor, perceptual or cognitive processes. These distributed systems are identified with principal components or eigenimages that correspond to spatial modes of coherent brain activity. This approach represents one of the simplest multivariate characterizations of functional neuroimaging time-series and falls into the class of exploratory analyses. Principal component or eigenimage analysis generally uses SVD to identify a set of orthogonal spatial modes that capture the greatest amount of variance, expressed over time. As such the ensuing modes embody the most prominent aspects of the variance-covariance structure of a given time-series. Noting that the covariances among brain regions is equivalent to functional connectivity renders eigenimage analysis particularly interesting because it was among the first ways of addressing functional integration (i.e. connectivity) with neuroimaging data. Subsequently, eigenimage analysis has been elaborated in a number of ways. Notable among these are canonical variate analysis (CVA) and multidimensional scaling (Friston et al 1996d,e). Canonical variate analysis was introduced in the context of ManCova (multiple analysis of covariance) and uses the generalized eigenvector solution to maximize the variance that can be explained by some explanatory variables relative to error. CVA can be thought of as an extension of eigenimage analysis that refers explicitly to some explanatory variables and allows for statistical inference.
In fMRI eigenimage analysis (Sychra et al 1994) is generally used as an exploratory device to characterize coherent brain activity. These variance components may, or may not be, related to experimental design and endogenous coherent dynamics have been observed in the motor system (Biswal et al 1995). Despite its exploratory power eigenimage analysis is fundamentally limited for two reasons. Firstly, it offers only a linear decomposition of any set of neurophysiological measurements and secondly the particular set of eigenimages or spatial modes obtained is uniquely determined by constraints that are biologically implausible. These aspects of PCA confer inherent limitations on the interpretability and usefulness of eigenimage analysis of biological time-series and have motivated the exploration of nonlinear PCA and neural network approaches (e.g. Mørch et al 1995).
Two other important approaches deserve mention here. The first is independent component analysis (ICA). ICA uses entropy maximization to find, using iterative schemes, spatial modes or their dynamics that are approximately independent. This is a stronger requirement than orthogonality in PCA and involves removing high order correlations among the modes (or dynamics). It was initially introduced as spatial ICA (McKeown et al 1998) in which the independence constraint was applied to the modes (with no constraints on their temporal expression). More recent approaches use, by analogy with magneto- and electrophysiological time-series analysis, temporal ICA where the dynamics are enforced to be independent. This requires an initial dimension reduction (usually using conventional eigenimage analysis). Finally, there has been an interest in cluster analysis (Baumgartner et al 1997). Conceptually, this can be related to eigenimage analysis through multidimensional scaling and principal coordinates analysis. In cluster analysis voxels in a multidimensional scaling space are assigned belonging probabilities to a small number of clusters, thereby characterizing the temporal dynamics (in terms of the cluster centroids) and spatial modes (defined by the belonging probability for each cluster). These approaches eschew many of the unnatural constraints imposed by eigenimage analysis and can be a useful exploratory device.
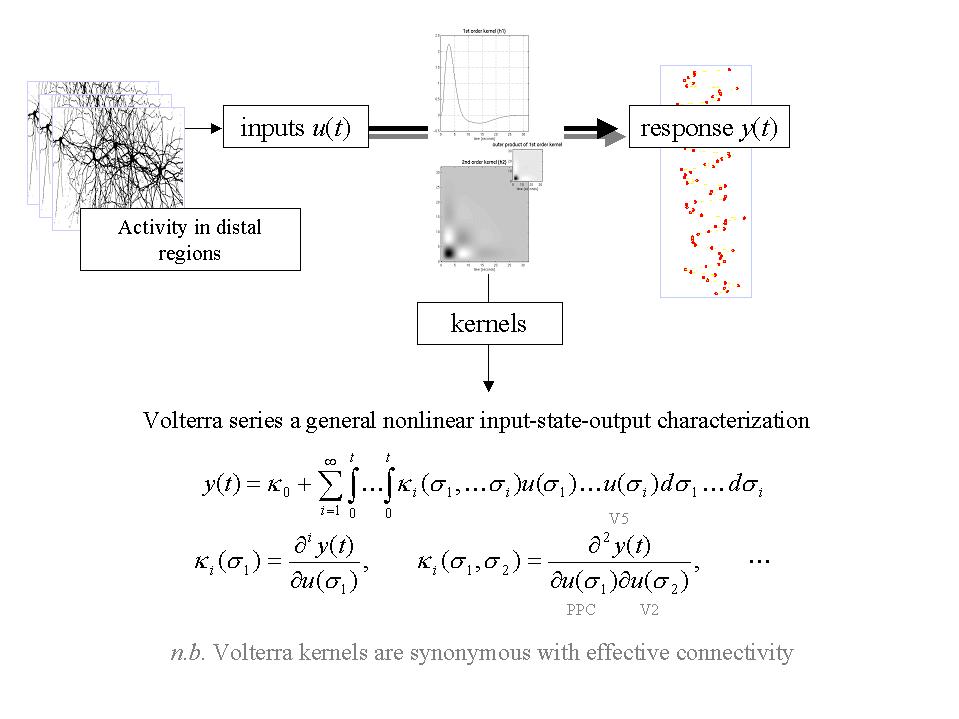
Figure 13. Schematic depicting the causal relationship between the outputs and the recent history of the inputs to a nonlinear dynamical system, in this instance a brain region or voxel. This relationship can be expressed as a Volterra series, which expresses the response or output y(t) as a nonlinear convolution of the inputs u(t), critically without reference to any [hidden] state variables. This series is simply a functional Taylor expansion of y(t) as a function of the inputs over the recent past. is the ith order kernel. Volterra series have been described as a 'power series with memory' and are generally thought of as a high-order or 'nonlinear convolution' of the inputs to provide an output. Volterra kernels are useful in characterizing the effective connectivity or influences that one neuronal system exerts over another because they represent the causal characteristics of the system in question. Neurobiologically they have a simple and compelling interpretation - they are synonymous with effective connectivity. It is evident that the first-order kernel embodies the response evoked by a change in input at . In other words it is a time-dependant measure of driving efficacy. Similarly the second order kernel reflects the modulatory influence of the input at on the evoked response at . And so on for higher orders.
Linear models of effective connectivity assume that the multiple inputs to a brain region are linearly separable. This assumption precludes activity-dependent connections that are expressed in one context and not in another. The resolution of this problem lies in adopting nonlinear models like the Volterra formulation that include interactions among inputs. These interactions can be construed as a context- or activity-dependent modulation of the influence that one region exerts over another, where that context is instantiated by activity in further brain regions exerting modulatory effects. These nonlinearities can be introduced into structural equation modeling using so-called 'moderator' variables that represent the interaction between two regions in causing activity in a third (Büchel et al 1997). From the point of view of regression models modulatory effects can be modeled with nonlinear input-output models and in particular the Volterra formulation described above. In this instance the inputs are not stimuli but activities from other regions. Because the kernels are high-order they embody interactions over time and among inputs and can be thought of as explicit measures of effective connectivity (see Figure 13). An important thing about the Volterra formulation is that it has a high face validity and biological plausibility. The only thing it assumes is that the response of a region is some analytic nonlinear function of the inputs over the recent past. This function exists even for complicated dynamical systems with many [unobservable] state variables. Within these models, the influence of one region on another has two components; (i) the direct or driving influence of input from the first (e.g. hierarchically lower) region, irrespective of the activities elsewhere and (ii) an activity-dependent, modulatory component that represents an interaction with inputs from the remaining (e.g. hierarchically higher) regions. These are mediated by the first and second order kernels respectively. The example provided in Figure 14 addresses the modulation of visual cortical responses by attentional mechanisms (e.g. Treue and Maunsell 1996) and the mediating role of activity-dependent changes in effective connectivity:
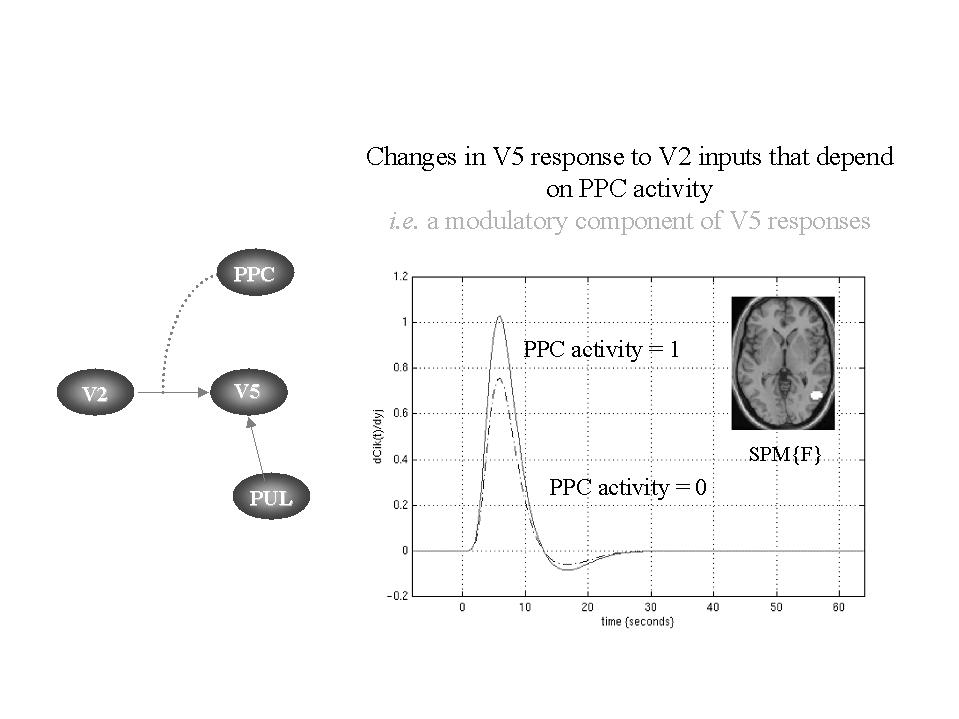
Figure 14. Left: Brain regions and connections comprising the effective connectivity model formulated in terms of a Volterra series (see Figure 13). Right: Characterization of the effects of V2 inputs on V5 and their modulation by posterior parietal cortex (PPC). The broken lines represent estimates of V5 responses when PPC activity is zero, according to a second order Volterra model of effective connectivity with inputs to V5 from V2, PPC and the pulvinar (PUL). The solid curves represent the same response when PPC activity is one standard deviation of its variation over conditions. It is evident that V2 has an activating effect on V5 and that PPC increases the responsiveness of V5 to these inputs. The insert shows all the voxels in V5 that evidenced a modulatory effect (p < 0.05 uncorrected). These voxels were identified by thresholding a SPM{F} testing for the contribution of second order kernels involving V2 and PPC (treating all other terms as nuisance variables). The data were obtained with fMRI under identical stimulus conditions (visual motion subtended by radially moving dots) whilst manipulating the attentional component of the task (detection of velocity changes).
The right panel in Figure 14 shows a characterization of this modulatory effect in terms of the increase in V5 responses, to a simulated V2 input, when posterior parietal activity is zero (broken line) and when it is high (solid lines). In this study subjects were studied with fMRI under identical stimulus conditions (visual motion subtended by radially moving dots) whilst manipulating the attentional component of the task (detection of velocity changes). The brain regions and connections comprising the model are shown in the upper panel. The lower panel shows a characterization of the effects of V2 inputs on V5 and their modulation by posterior parietal cortex (PPC) using simulated inputs at different levels of PPC activity. It is evident that V2 has an activating effect on V5 and that PPC increases the responsiveness of V5 to these inputs. The insert shows all the voxels in V5 that evidenced a modulatory effect (p < 0.05 uncorrected). These voxels were identified by thresholding a SPM{F} testing for the contribution of second order kernels involving V2 and PPC while treating all other components as nuisance variables. The estimation of the Volterra kernels and statistical inference procedure is described in Friston and Büchel (2000c).