|
Statistical Parametric Mapping |
|
|
Karl J Friston |
|
|
Wellcome Dept. of Imaging Neuroscience |
The brain appears to adhere to two fundamental principles of functional organization, functional integration and functional specialization, where the integration within and among specialized areas is mediated by effective connectivity. The distinction relates to that between localisationism and [dis]connectionism that dominated thinking about cortical function in the nineteenth century. Since the early anatomic theories of Gall, the identification of a particular brain region with a specific function has become a central theme in neuroscience. However functional localization per se was not easy to demonstrate: For example, a meeting that took place on August 4th 1881 addressed the difficulties of attributing function to a cortical area, given the dependence of cerebral activity on underlying connections (Phillips et al 1984). This meeting was entitled "Localization of function in the cortex cerebri". Goltz (1881), although accepting the results of electrical stimulation in dog and monkey cortex, considered that the excitation method was inconclusive, in that movements elicited might have originated in related pathways, or current could have spread to distant centers. In short, the excitation method could not be used to infer functional localization because localisationism discounted interactions, or functional integration among different brain areas. It was proposed that lesion studies could supplement excitation experiments. Ironically, it was observations on patients with brain lesions some years later (see Absher and Benson 1993) that led to the concept of disconnection syndromes and the refutation of localisationism as a complete or sufficient explanation of cortical organization. Functional localization implies that a function can be localized in a cortical area, whereas specialization suggests that a cortical area is specialized for some aspects of perceptual or motor processing, and that this specialization is anatomically segregated within the cortex. The cortical infrastructure supporting a single function may then involve many specialized areas whose union is mediated by the functional integration among them. In this view functional specialization is only meaningful in the context of functional integration and vice versa.
The functional role played by any component (e.g. cortical area, subarea or neuronal population) of the brain is largely defined by its connections. Certain patterns of cortical projections are so common that they could amount to rules of cortical connectivity. "These rules revolve around one, apparently, overriding strategy that the cerebral cortex uses - that of functional segregation" (Zeki 1990). Functional segregation demands that cells with common functional properties be grouped together. This architectural constraint necessitates both convergence and divergence of cortical connections. Extrinsic connections among cortical regions are not continuous but occur in patches or clusters. This patchiness has, in some instances, a clear relationship to functional segregation. For example, V2 has a distinctive cytochrome oxidase architecture, consisting of thick stripes, thin stripes and inter-stripes. When recordings are made in V2, directionally selective (but not wavelength or color selective) cells are found exclusively in the thick stripes. Retrograde (i.e. backward) labeling of cells in V5 is limited to these thick stripes. All the available physiological evidence suggests that V5 is a functionally homogeneous area that is specialized for visual motion. Evidence of this nature supports the notion that patchy connectivity is the anatomical infrastructure that mediates functional segregation and specialization. If it is the case that neurons in a given cortical area share a common responsiveness (by virtue of their extrinsic connectivity) to some sensorimotor or cognitive attribute, then this functional segregation is also an anatomical one. Challenging a subject with the appropriate sensorimotor attribute or cognitive process should lead to activity changes in, and only in, the area of interest. This is the anatomical and physiological model upon which the search for regionally specific effects is based .
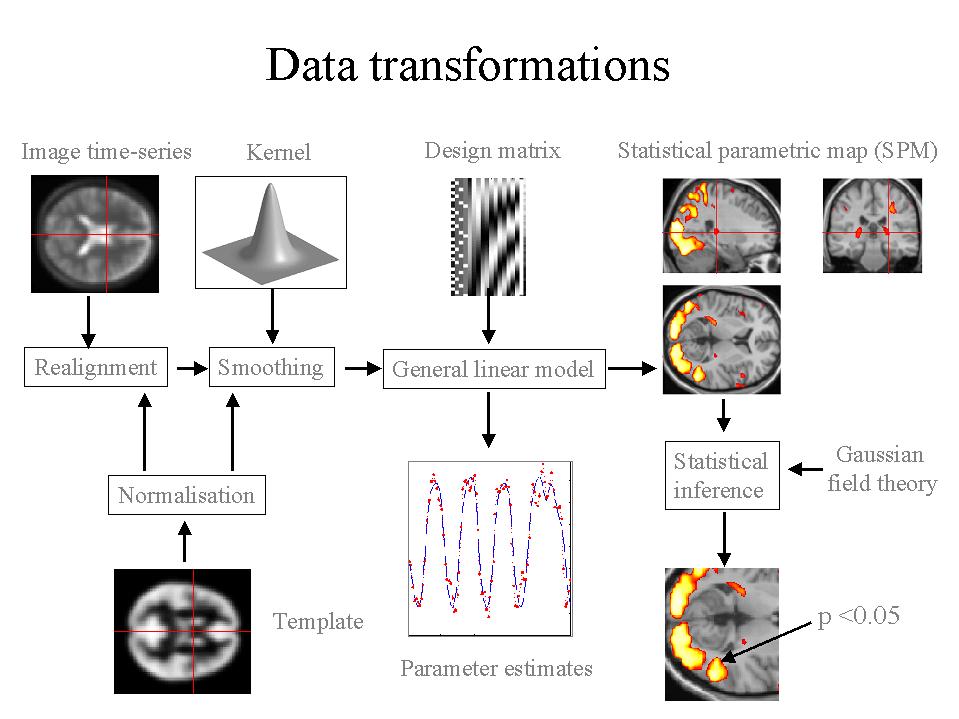
The analysis of functional neuroimaging data involves many steps that can be broadly divided into; (i) spatial processing, (ii) estimating the parameters of a statistical model and (iii) making inferences about those parameter estimates with their associated statistics (see Figure 1). We will deal first with spatial transformations: In order to combine data from different scans from the same subject, or data from different subjects it is necessary that they conform to the same anatomical frame of reference. This is the subject of the next section.
Figure 1. This schematic depicts the transformations that start with an imaging data sequence and end with a statistical parametric map (SPM). SPMs that can be thought of as 'X-rays' of the significance of an effect. Voxel-based analyses require the data to be in the same anatomical space: This is effected by realigning the data (and removing movement-related signal components that persist after realignment). After realignment the images are subject to non-linear warping so that they match a template that already conforms to a standard anatomical space. After smoothing, the general linear model is employed to (i) estimate the parameters of the model and (ii) derive the appropriate univariate test statistic at every voxel (see Figure 3). The test statistics that ensue (usually T or F statistics) constitute the SPM. The final stage is to make statistical inferences on the basis of the SPM and Gaussian random field theory (see Figure 6) and characterize the responses observed using the fitted responses or parameter estimates.