Flexible factorial
In this tutorial we will look at experimental designs with two or more factors (experimental manipulations) at the between-subjects level. The key strength of factorial designs is they allow us to test for interactions between different factors, as well as the individual effects of each factor (main effects). We will do this using a flexible factorial design and the previously introduced dataset.
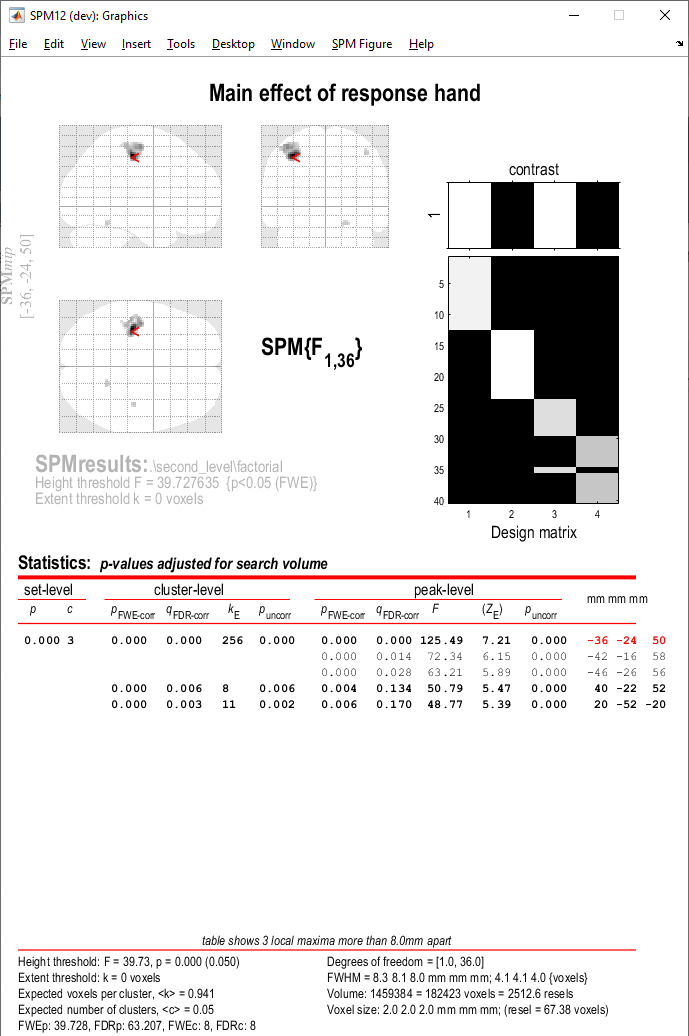
We will use the contrast corresponding to overall task activation (con_0009.nii) and explore whether there is an interaction between participants’ handedness and the hand used to execute a task response. As you may remember from the data description, we have four groups of participants here: (1) right handed responding with their right hand, (2) right handed responding with their left hand, (3) left handed responding with their right hand, and (4) left handed responding with their left hand. This is referred to as a 2-by-2 design, with factors response hand (left or right) and handedness (left or right).
Specifying the model
- Make an empty folder (directory) where you will save your results. Navigate to
derivatives/second_leveland make a folder for this analysis. Name it something meanigful to you, e.g.factorial_handedness_response_hand_task. - Select
Specify 2nd levelfrom the SPM menu. - In the pop-up batch editor window, select your newly created output folder by clicking
Directoryand navigating toderivatives/second_level/factorial_handedness_response_hand_taskin the selection box. - Define your statistical model by selecting
DesignFlexible factorial. - Now, under
Factorsspecify the factors you want to investigate, (1)NameHandedness, (2)NameResponse hand. Leave the remaining options as default. - Now let’s input our data. Under
Specify subjects or all scans & factorsyou’ll have two ways to do this. You can either specify your subjects and factors on at a time or select all the relevant scans for all subjects in one step and manually specify a corresponding factor matrix. We will choose the latter option,Specify subjects or all scans & factorsSpecify all. - Under
Scanswe will specify all contrast images corresponding to task activation (con_0009.nii) for all participants. Using the selection window recursively filter for contrastcon_0009.nii. To do this, navigate toderivatives/first-levelvia the left-hand side panel. In the filter box, type in^con_0009.niiand click theRecbutton. You should see 40 volumes selected in the bottom window. Double check that the correct contrast and subjects have been selected. Confirm selection by pressingDone. -
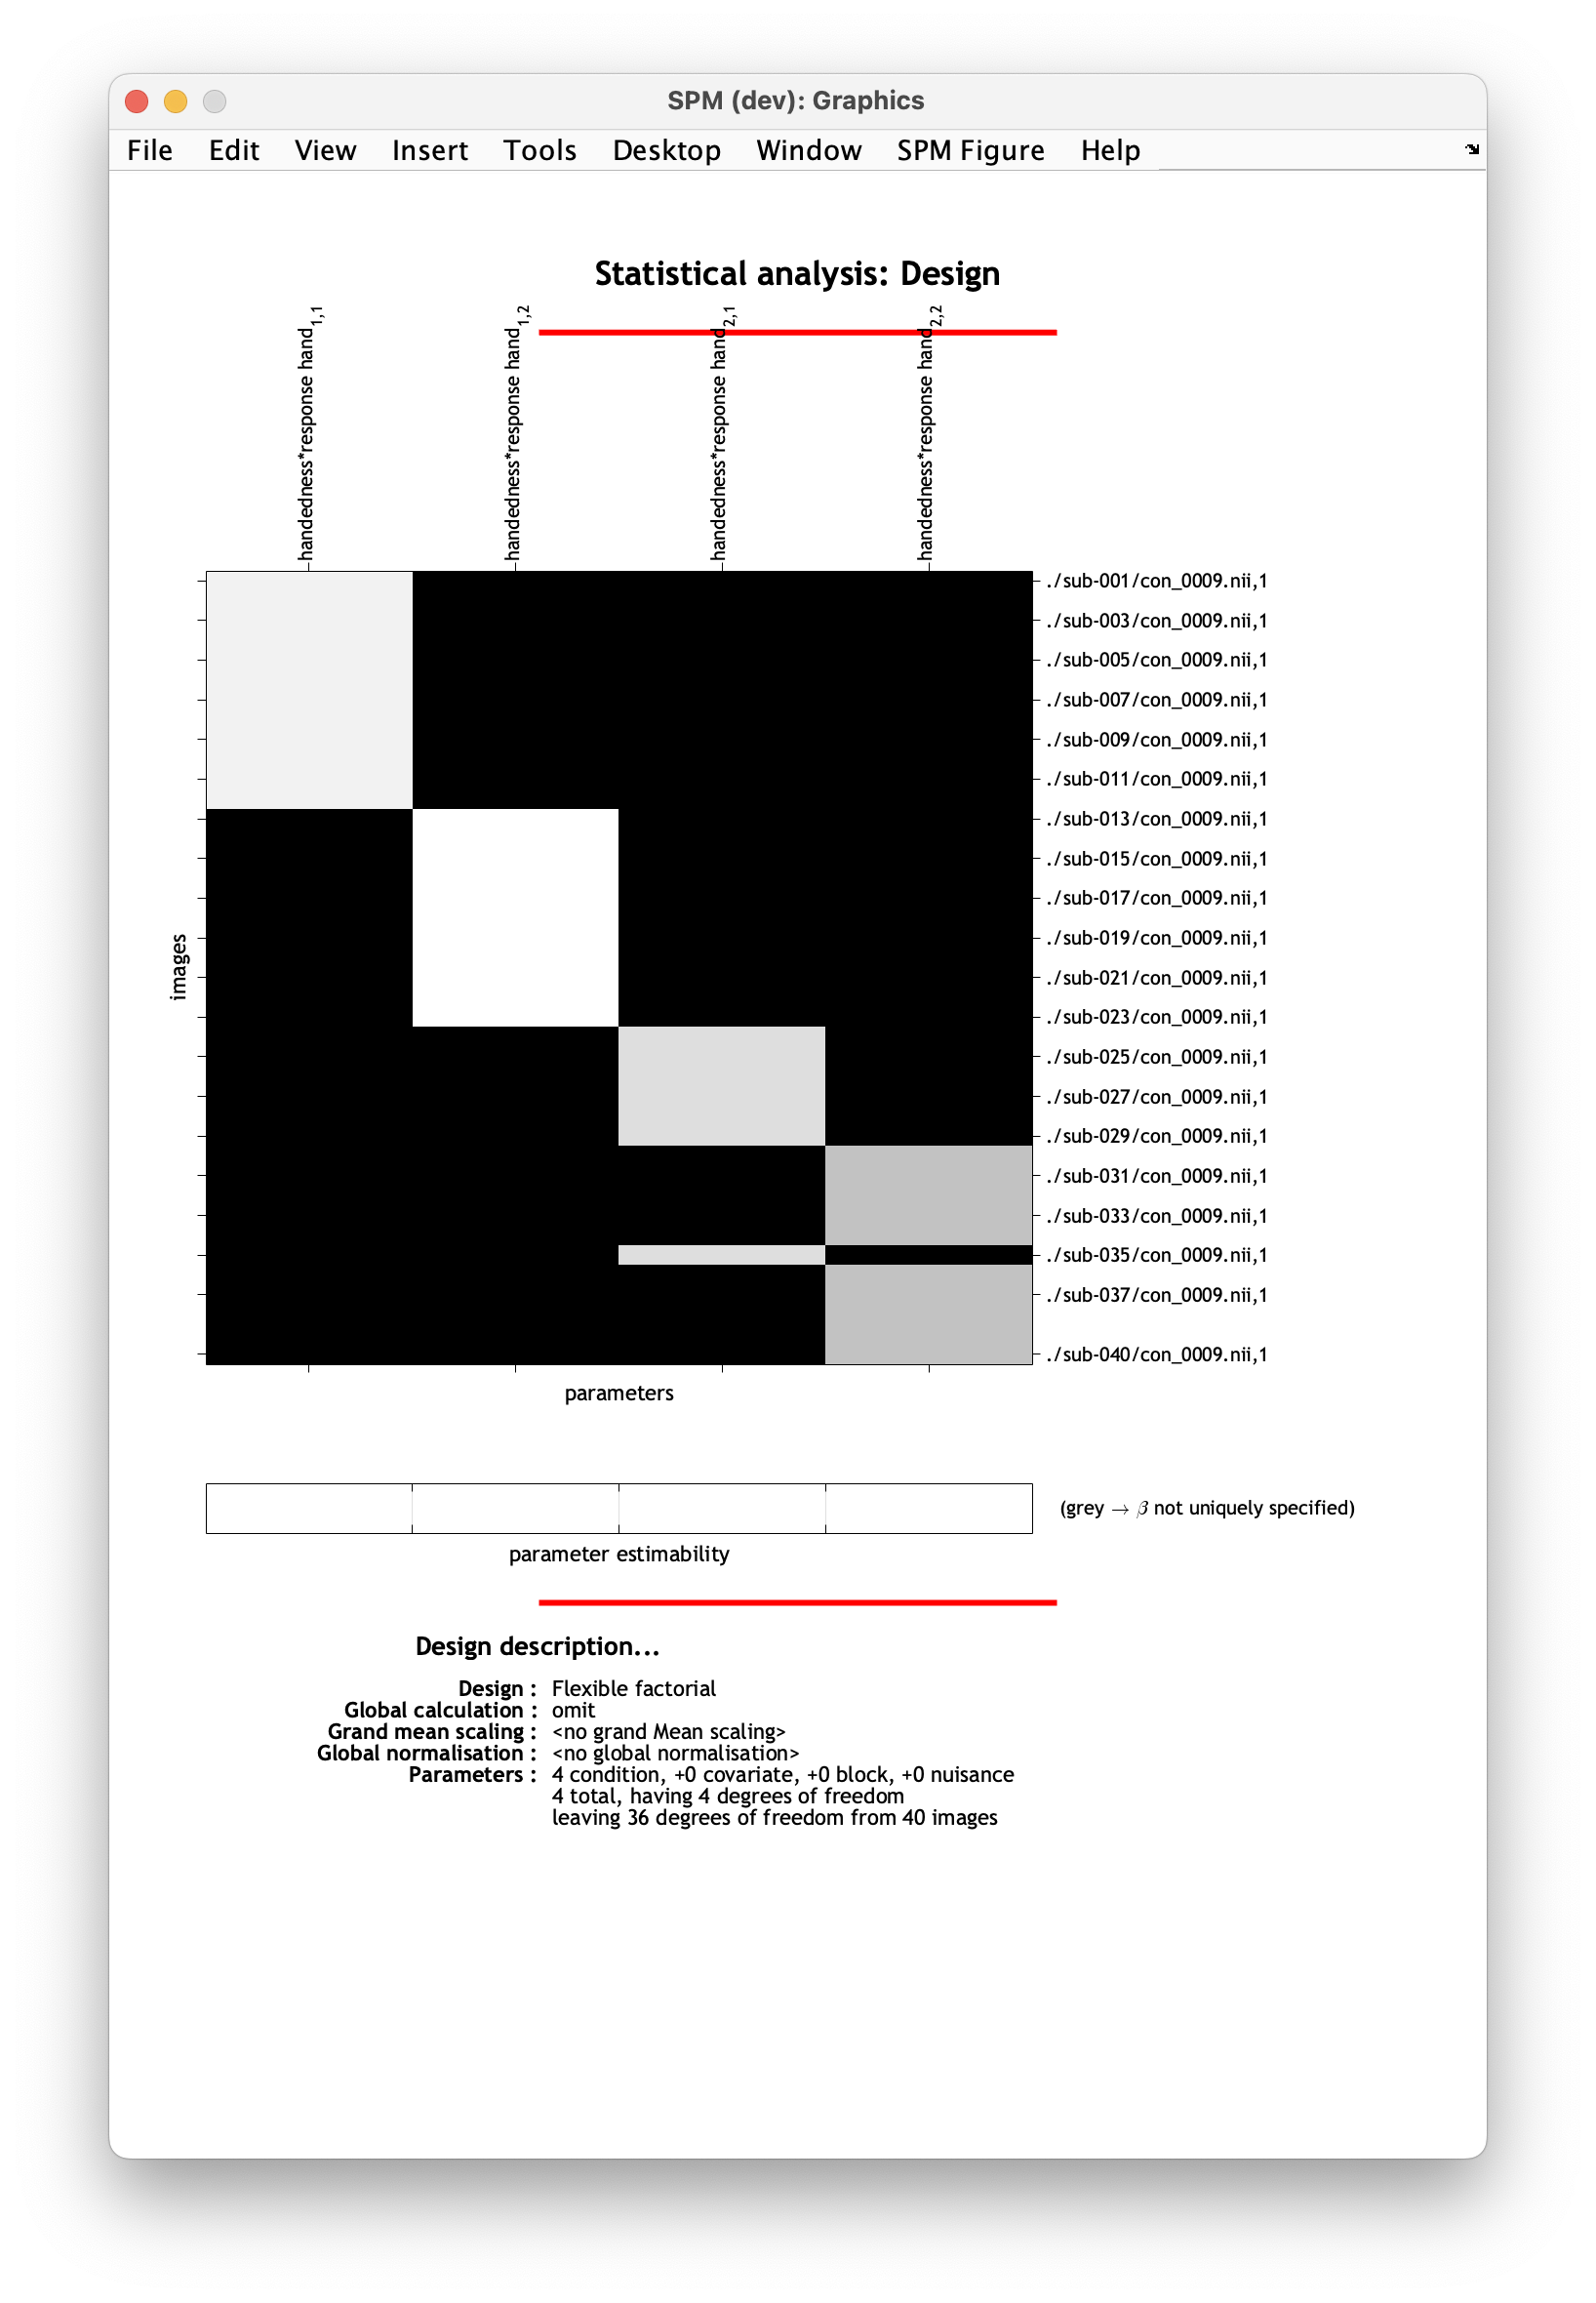
Now, we’ll specify our factor matrix, which identifies which scans go with which experimental factors. SPM can model the effects of up to three factors, plus participant effects. Therefore the matrix has a maximum of 4 columns (
nscans-by-4). For this example, we have 40 participants and one scan from each participant (^con_0009.nii). Our matrix is as follows:1 1 1 2 1 1 3 1 1 4 1 1 5 1 1 6 1 1 7 1 1 8 1 1 9 1 1 10 1 1 11 1 1 12 1 1 13 1 2 14 1 2 15 1 2 16 1 2 17 1 2 18 1 2 19 1 2 20 1 2 21 1 2 22 1 2 23 1 2 24 2 1 25 2 1 26 2 1 27 2 1 28 2 1 29 2 1 30 2 2 31 2 2 32 2 2 33 2 2 34 2 2 35 2 1 36 2 2 37 2 2 38 2 2 39 2 2 40 2 2Let’s break it down.
The first column indicates which participant each image belongs to. It should contain distinct contiguous integers if you’re including a single scan per participant. If you have multiple scans per participant, make sure that rows corresponding to the same participants in the factor matrix are marked with the same index.
The following two columns mark the factors and their levels. In our case, we have two factors (handedness and response hand) with two levels each (1=left and 2=right). That’s why we have two columns filled with 1’s and 2’s. The second column indicates which level of the handedness factor each image belongs to, and the third column indicates which level of the response hand factor each image belongs to.
Copy and paste the matrix above into Factor matrix box and click OK.
-
We will now choose the regressors that will appear in the design matrix. We will ask SPM to model our interaction - select
Main effects & interactionsNew: Interaction. -
Under factor numbers, specify the factors you want to investigate in your interaction. In our case
1 2.Top tip
The first column of your factor matrix (i.e. participant index) is not counted as a factor by SPM, hence why for main effects and interactions we give the second and third columns indices 1 and 2, respectively.
-
From the drop-down menu panel, select
SPMStatsModel estimation. - Navigate to
Model estimationin the left-hand panel of the batch window. - Press
Select SPM.matDependencyFactorial design specification: SPM.mat fileOK. - From the drop-down menu panel, select
SPMStatsContrast manager. - Within the
Contrast manager, click onSelect SPM.matDependencyModel estimation: SPM.mat fileOK. - You can now start specifying your contrasts of interest in
Contrast sessions. We will specify F-contrasts rather than T-contrasts, to show both positive and negative effects. - Select
Contrast sessionsNew: F-contrast. - Name your contrast,
NameSpecify...main effect of handedness. - Specify your contrast weight,
Weights matrixSpecify...1 1 -1 -1. - Now, do the same for the main effect of response hand -
Contrast sessionsNew: F-contrast.NameSpecify...main effect of response hand.Weights matrixSpecify...1 -1 1 -1. - And now do this for the interaction,
Contrast sessionsNew: F-contrast.NameSpecify...interaction.Weights matrixSpecify...1 -1 -1 1. - When you’re ready, save your batch and press to run your analysis.
Your design matrix will have four columns corresponding to the elements of the interaction:
- Left-handed * left response hand
- Left-handed * right response hand
- Right-handed * left response hand
- Right-handed * right response hand
Viewing the results
Let’s inspect the results. Load each contrast image adjusting the thresholds as needed (for a reminder on how to do that, see the one sample t-test tutorial). You will notice that while we observe a main effect of response hand, there are no main effects of handedness or interaction effects that survive multiple comparisons correction.