Two-sample t-test
In this tutorial we will look at comparing two groups of participants. To do this we will use a two-sample t-test, using the dataset previously introduced.
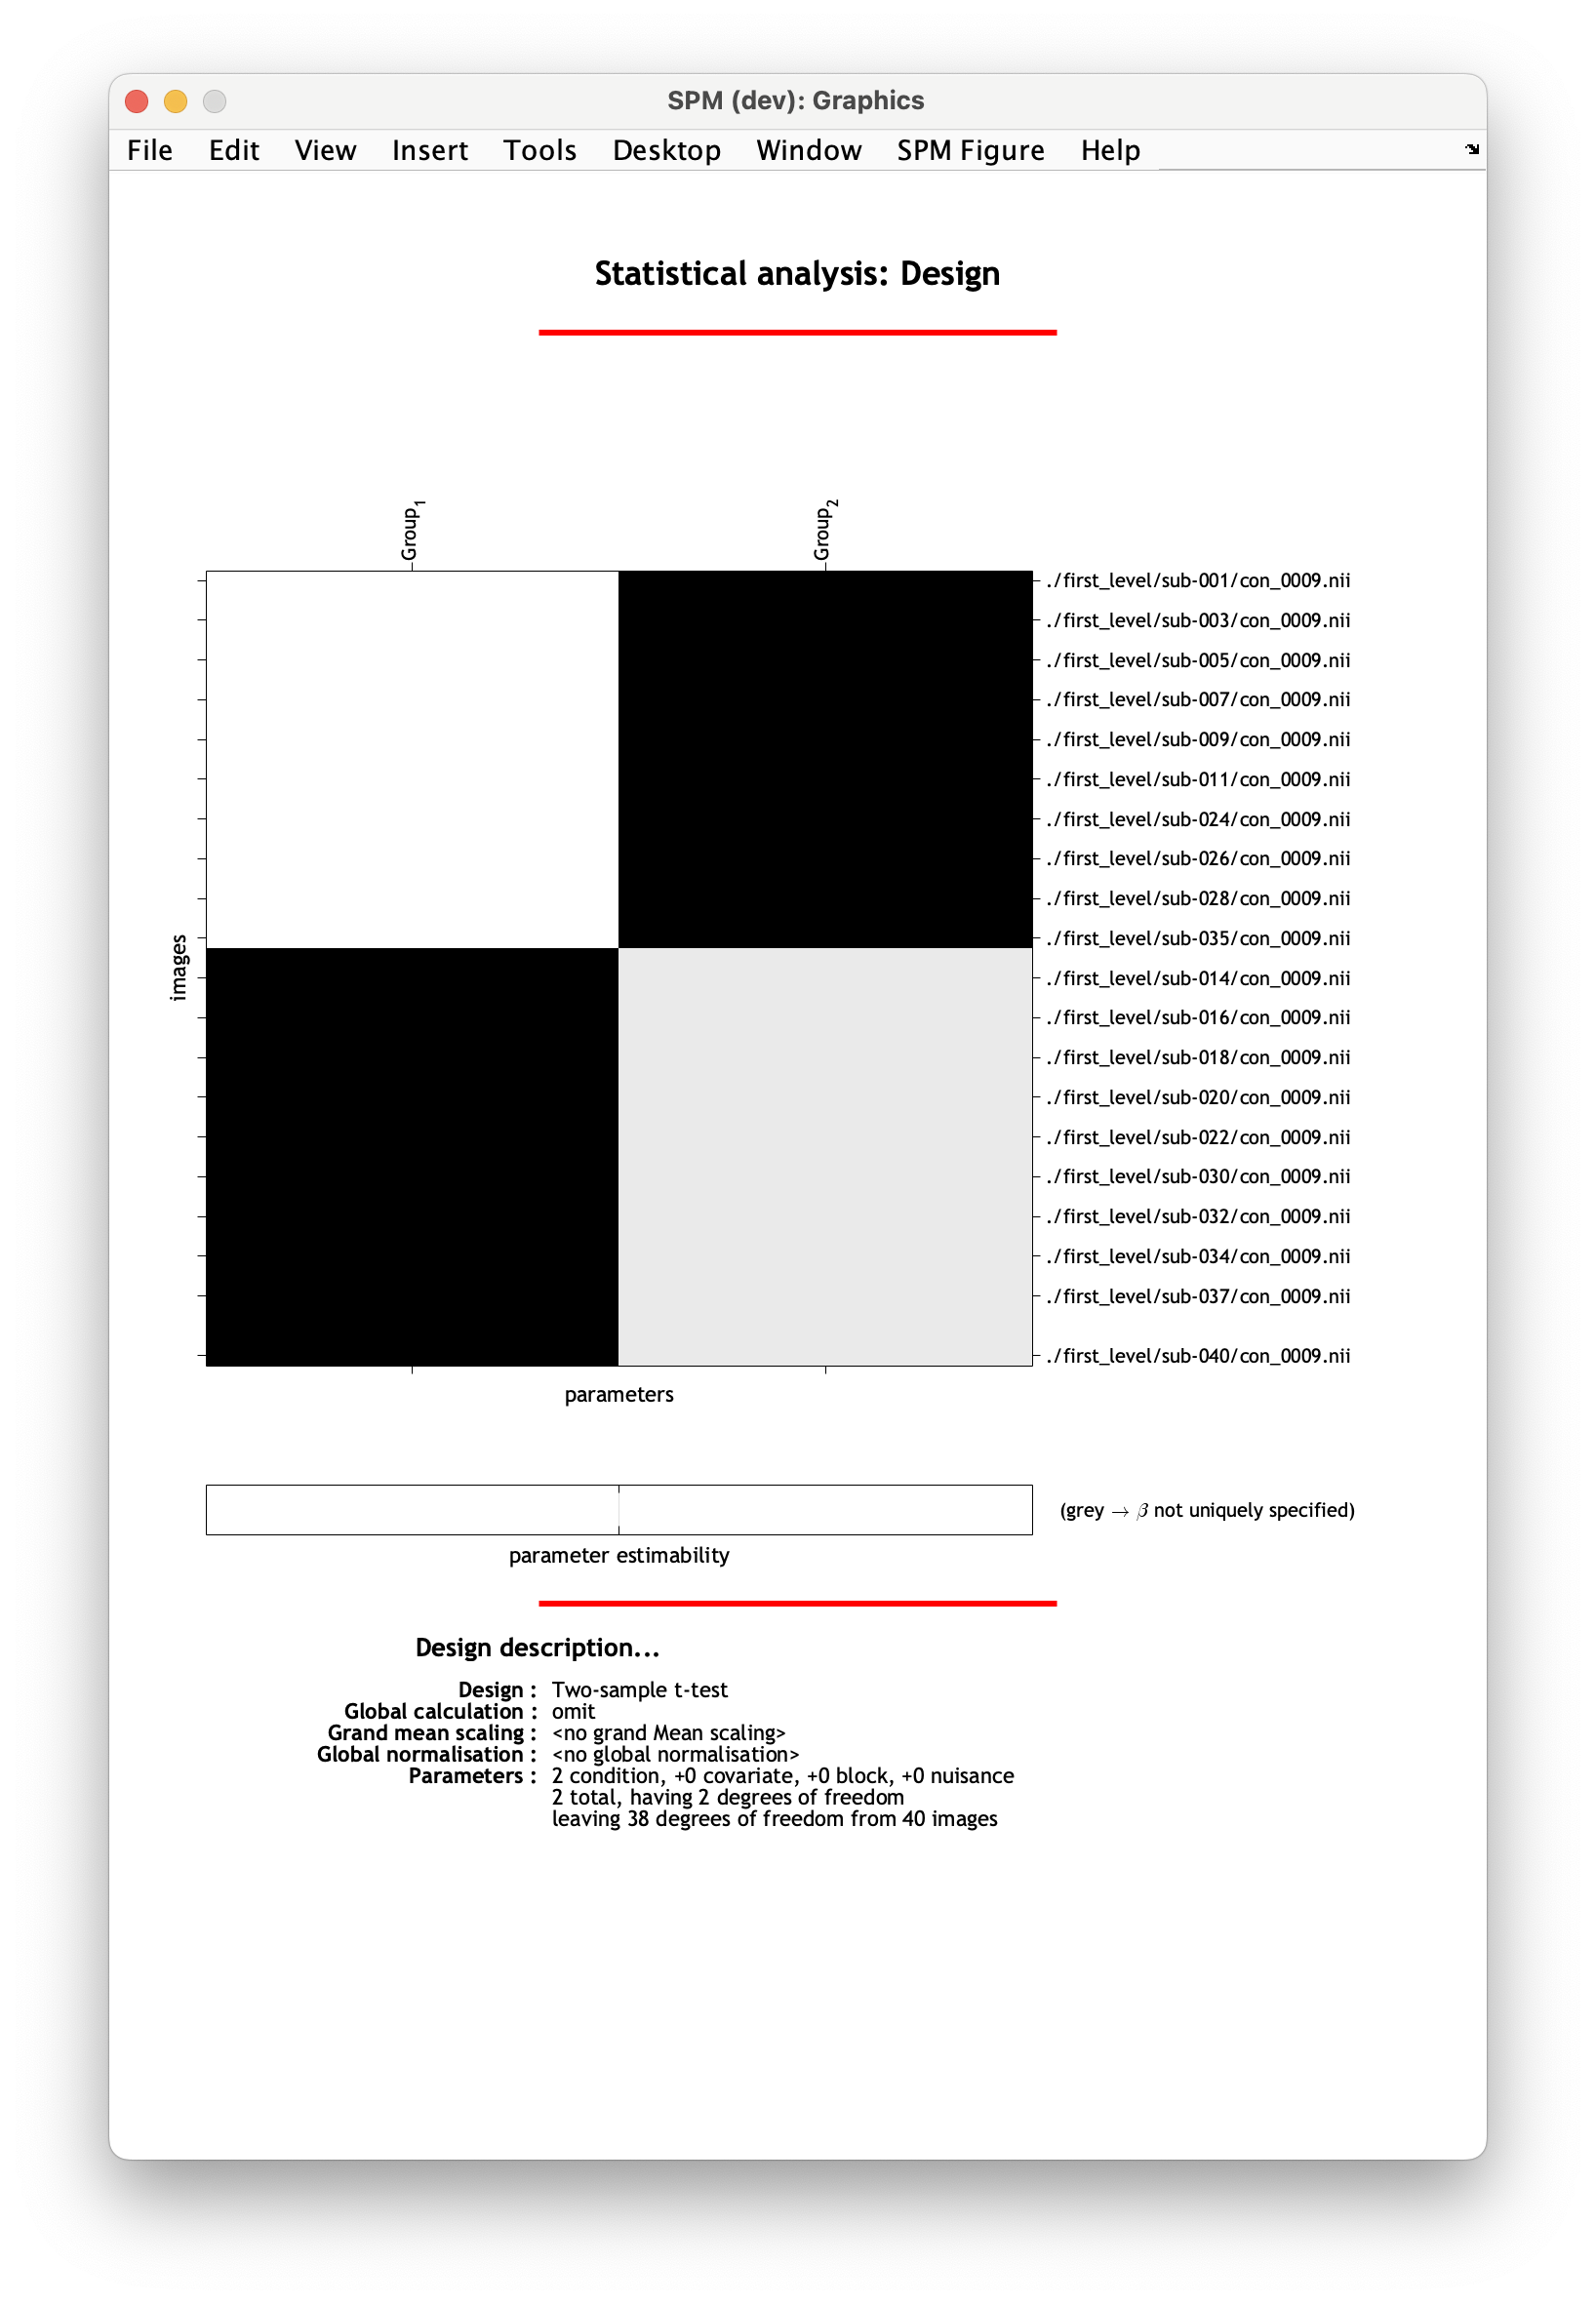
We will focus on testing for a difference in overall task activation (contrast con_0009.nii) depending on whether participants responded with their left or right hand.
Specifying the model
- Navigate to
derivatives/second_leveland make an empty folder where you will save your results. Name it something meaningful to you, e.g.two_sample_ttest_task. - Switch to this new directory (folder) in MATLAB, using the file navigator (typically on the left hand side of the MATLAB window).
- We will now define our groups based on the information in
participants.mat. - In your MATLAB command window, load the file:
load('participants.mat'). - You can view the contents of the file in the MATLAB window. You will see that there is a variable called
response handwhich codes for which hand the participant used to make task responses.0corresponds to left,1to right. -
We will define a variable selecting all participants who responses with their left hand. Copy and paste the following code into the MATLAB command window and press enter:
% identify which rows in the spreadsheet correspond to left-hand responders group1_id = find(participants.response_hand ~= true) % for each left-hand responder, create a full path to the contrast exploring task effects (con_0009.nii) for i = 1:numel(group1_id) sub = participants.id_string{group1_id(i)} img_group1{i} = char(fullfile(pwd, "derivatives/first_level", sub, "con_0009.nii")) endimg_group1holds all the folders pointing to left-handed responder’scon_0009.nii. -
Now we’ll do the same for the right-hand responders:
% identify which rows in the spreadsheet correspond to right-hand responders group2_id = find(participants.response_hand == true) % for each right-hand responder, create a full path to the contrast exploring task effects (con_0009.nii) for i = 1:numel(group2_id) sub = participants.id_string{group2_id(i)} img_group2{i} = char(fullfile(pwd, "derivatives/first_level", sub, "con_0009.nii")) endimg_group2holds all folders pointing to right-hand responder’scon_0009.nii. -
Return to the main SPM menu window and select
Specify 2nd level. - In the pop-up batch editor window, select your newly created output folder by clicking
Directoryand navigating toderivatives/second_level/two_sample_ttest_taskin the selection box. - Define your statistical model by selecting
DesignTwo-sample t-test - Select
Group 1 scansSpecify.... Bring up the edit window by clickingEdin the file selection window. - From the edit window, you can now insert the variables you have saved in MATLAB. Type in
img_group1and pressEval. This should fill the window with full paths to each left-hand responder’scon_0009.niifile. ClickAcceptDone. - Let’s do the same thing for right-hand responders.
Group 2 scansSpecify...Edimg_group2EvalAcceptDone. - From the drop-down menu, select
SPMStatsModel estimation. - Navigate to
Model estimationin the left-hand panel of the batch window. - Press
Select SPM.matDependencyFactorial design specification: SPM.mat fileOK. - From the drop-down menu panel, select
SPMStatsContrast manager. - Within the
Contrast manager, click onSelect SPM.matDependencyModel estimation: SPM.mat fileOK. - You can now start specifying your contrasts of interest in
Contrast sessionscomparing left to right hand responders and vice versa. - Select
Contrast sessionsNew: T-contrast. - Name your contrast,
NameSpecify...left > right. - Specify your contrast weight,
Weights vectorSpecify...1 -1. - Now, do the same for the reverse contrast -
Contrast sessionsNew: T-contrast.NameSpecify...right > left.Weights vectorSpecify...-1 1. - When you’re ready, save your batch and press to run your analysis.
Your design matrix should have two columns specifying left-hand and right-hand responders:
Viewing the results
To view the results of your analysis, select Results from the SPM menu and select the SPM.mat file corresponding to your analysis. In our case, this will be in derivatives/second_level/two_sample_ttest_task. Choose a contrast to view, e.g. left > right.
SPM will now let you select masking and multiple comparisons correction. Select the following in the SPM window:
Apply maskingnoneP-value adjustment to controlFWEP-value0.05Extent threshold (voxels)0
After going through these steps, SPM will display the results as an activation map and summary table:
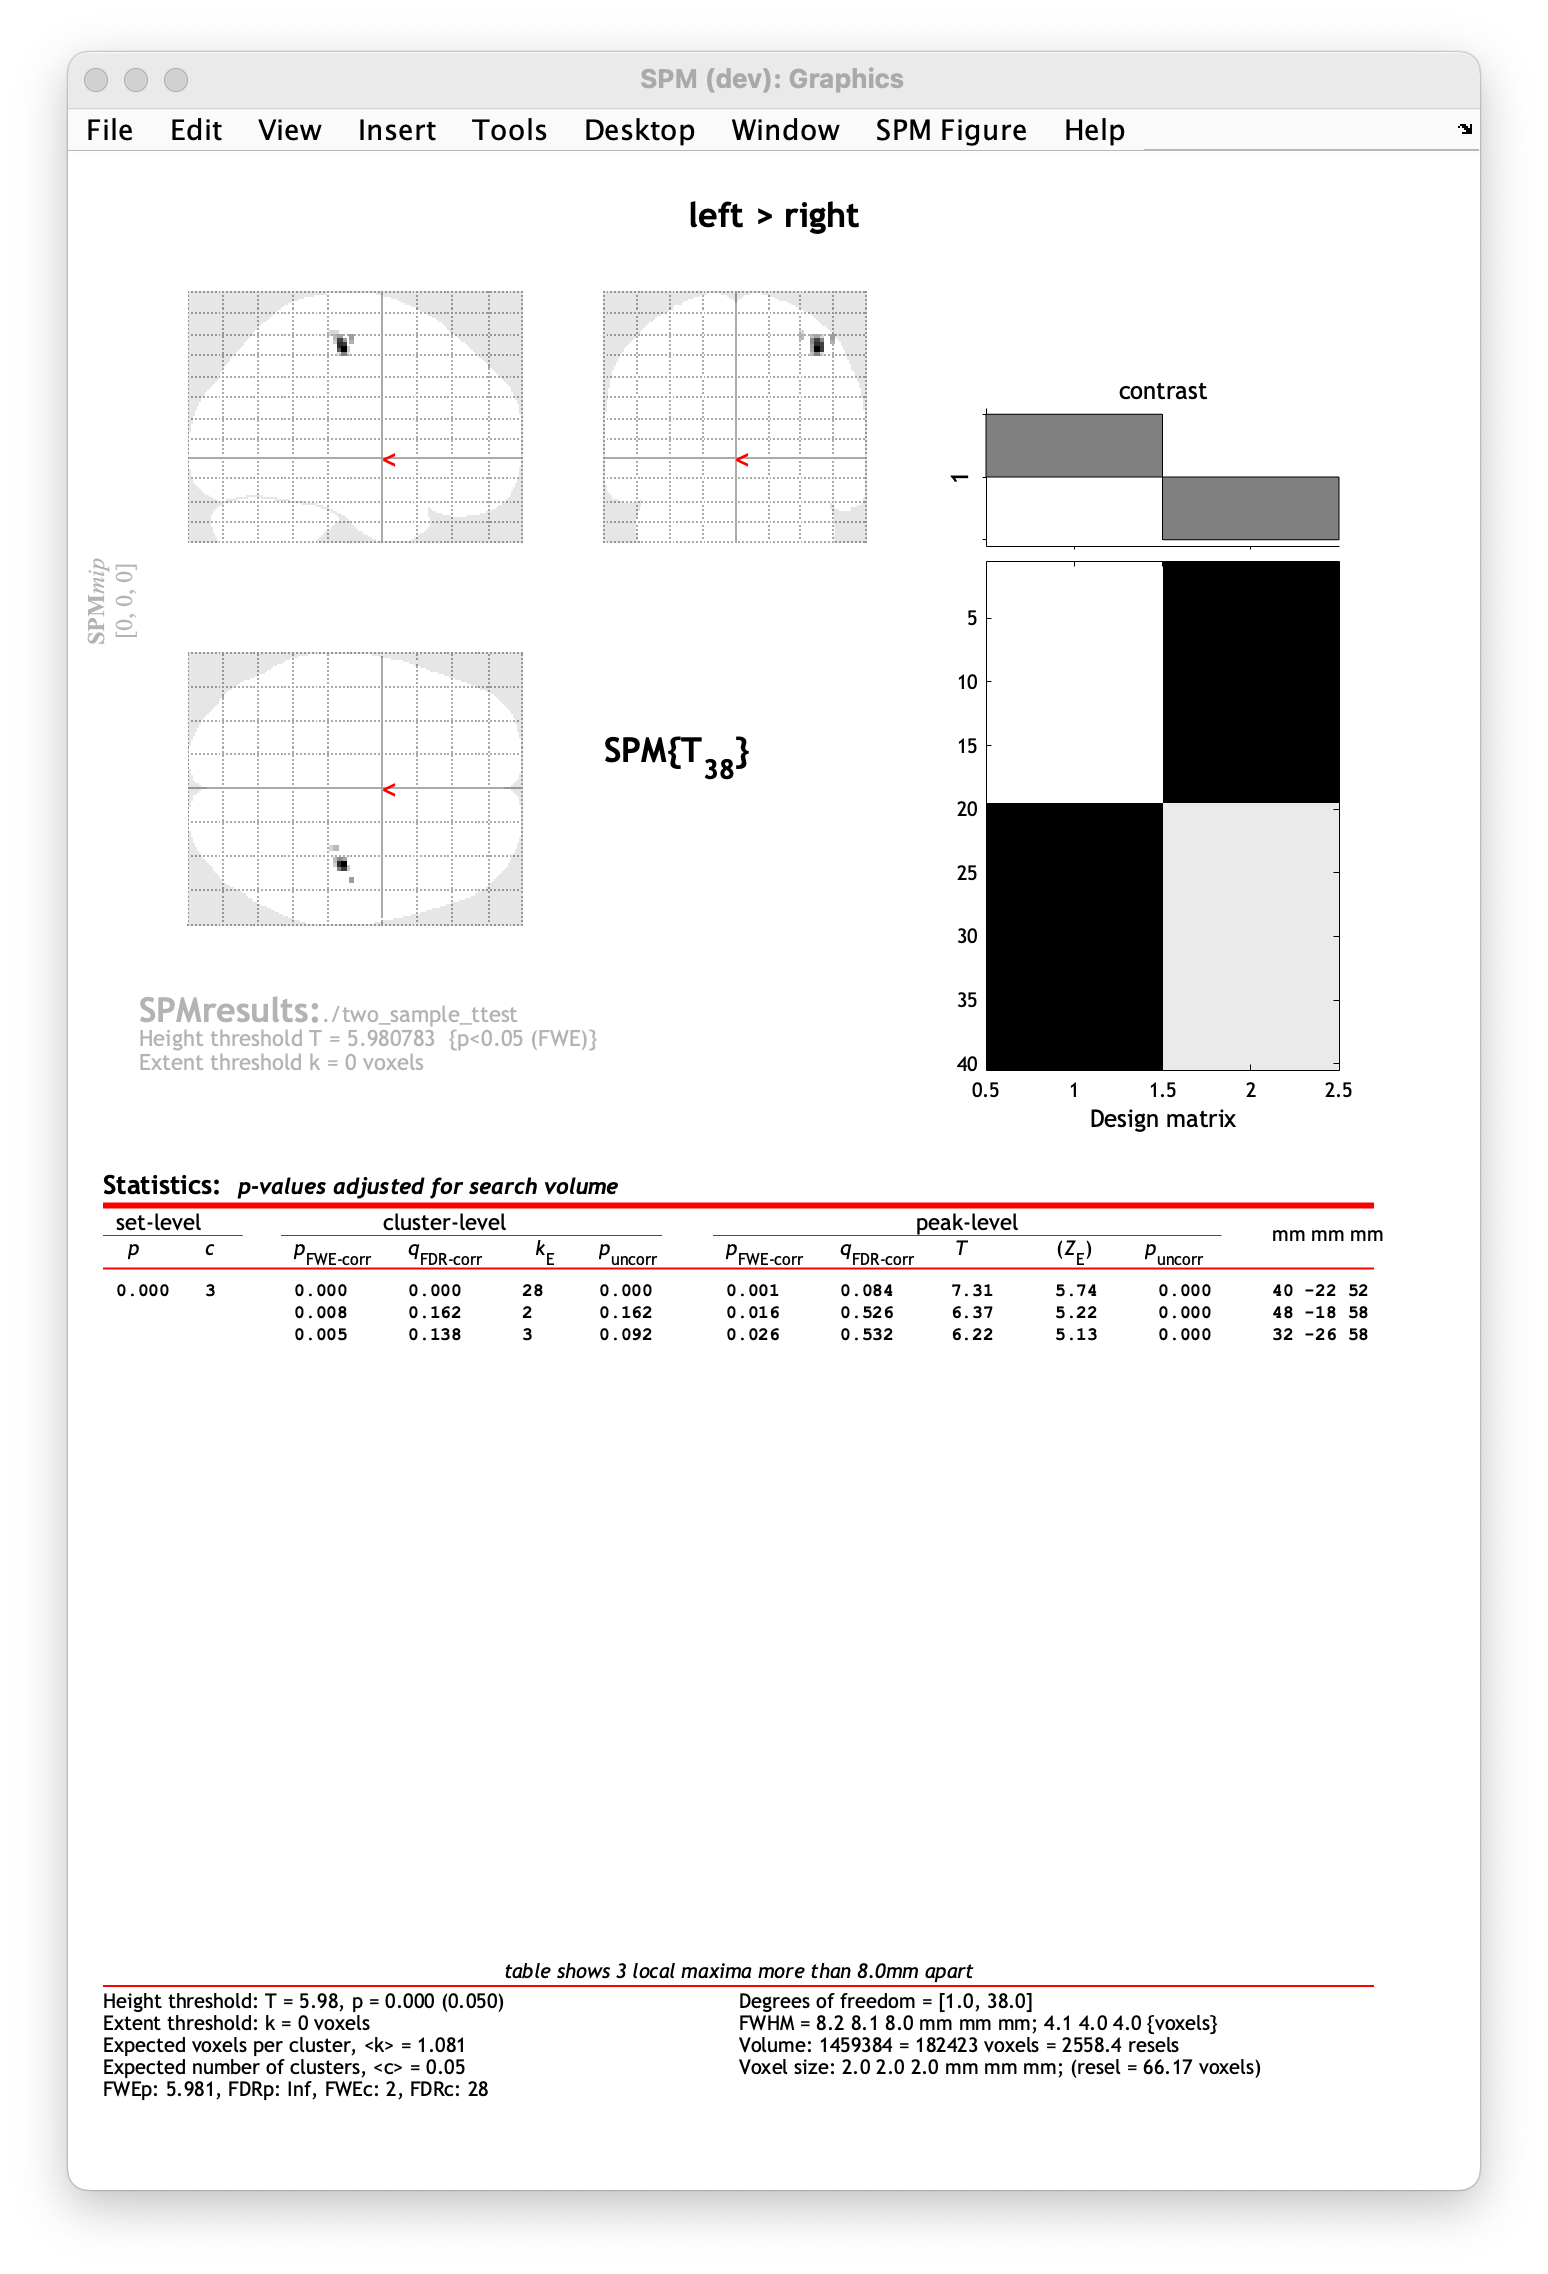
We can see that participants who used their left-hand to make responses had stronger (more positive) activation in the contralateral (right) motor cortex.
Exercise
Can you follow the steps above to view the second contrast we specified? What do you expect the results will be? Can you display them as a heatmap on a standard template?
If you need a reminder of what any of the options in the SPM results window are, visit the one-sample t-test tutorial.