Face fMRI data
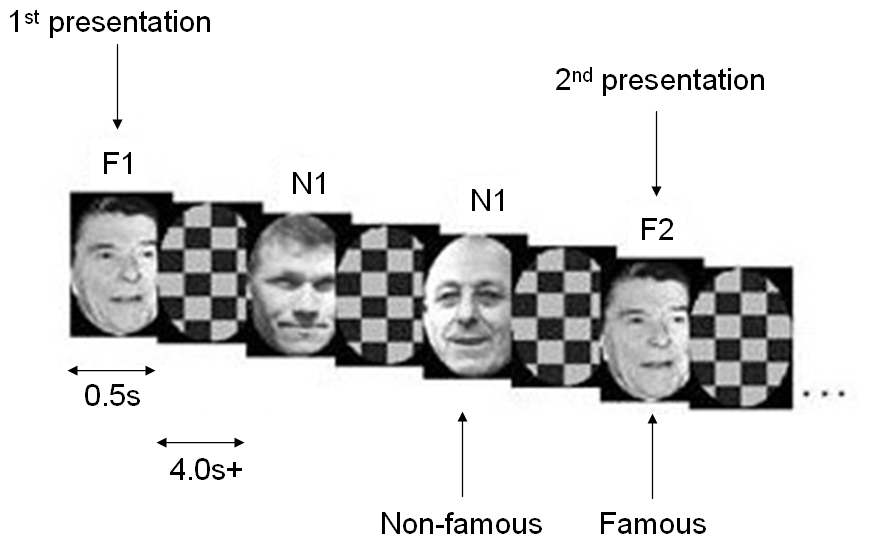
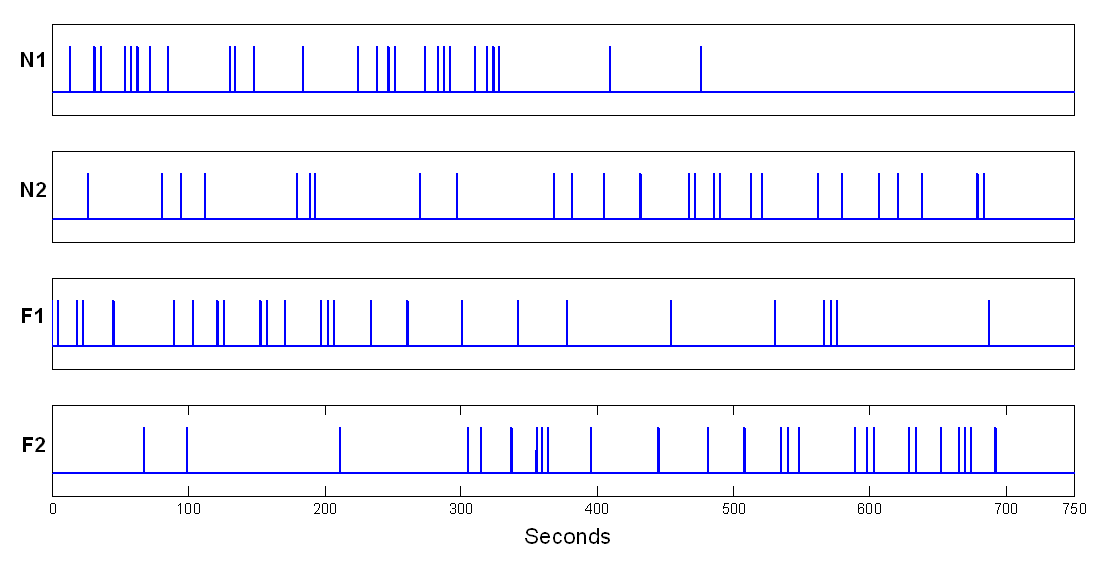
As another, more sophisticated example, consider the data from a repetition priming experiment performed using event-related fMRI. Briefly, this is a 2\(\times\)2 factorial study with factors “fame” and “repetition” where famous and non-famous faces were presented twice against a checkerboard baseline (for more details, see (Henson et al. 2002)). The subject was asked to make fame judgements by making key presses. There are thus four event-types of interest; first and second presentations of famous and non-famous faces, which we denote N1, N2, F1 and F2. The experimental stimuli and timings of events are shown the next two figures.
Images were acquired using continuous Echo-Planar Imaging (EPI) with
TE=40ms, TR=2s and 24 descending slices (64\(\times\)64
3\(\times\)3 mm\(^2\)), 3mm thick with a 1.5mm gap. The data archive
is available from the SPM website. This contains 351 Analyze format
functional images sM03953_0005_*.{hdr,img} of dimension
64\(\times\)64\(\times\)24 with
3\(\times\)3\(\times\)4.5 mm\(^3\) voxels. A structural image
is also provided in Analyze format (sM03953_0007.{hdr,img}).
To analyse the data, first create a new folder DIR eg.
C:\data\face_rep, in which to place the
results of your analysis. Then create three subfolders (i) jobs, (ii)
categorical, (iii) parametric and (iv) bayesian. As the analysis
proceeds, these folders will be filled with job-specification files,
design matrices and models estimated using classical or Bayesian methods.
As well as the classical/Bayesian distinction we will show how this data can be analysed from a parametric as well as a categorical perspective. We will look at the main effects of fame and repetition and in the parametric analysis we will look at responses as a function of “lag”, that is, the number of faces intervening between repetition of a specific face.
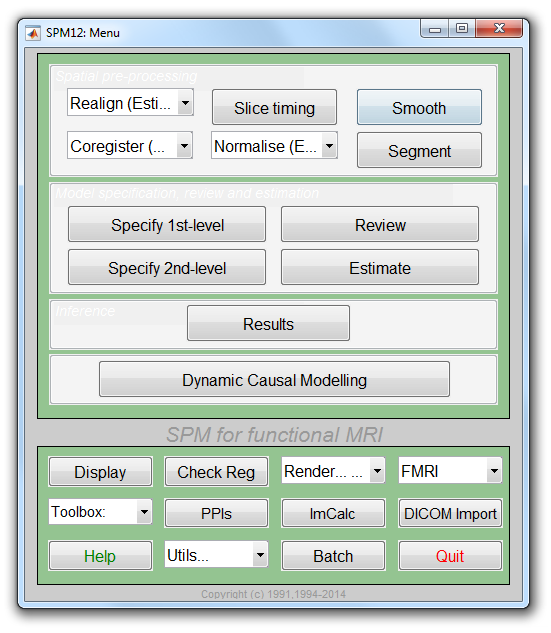
Start up MATLAB, navigate into your jobs folder and type spm fmri at the
MATLAB prompt. SPM will then open in fMRI mode with three windows (1)
the top-left or “Menu” window, (2) the bottom-left or “Interactive”
window and (3) the right-hand or “Graphics” window. Analysis then takes
place in three major stages (i) spatial pre-processing, (ii) model
specification, review and estimation and (iii) inference. These stages
organise the buttons in SPM’s base window.